Services – Oceanography Consultancy
 Sea Ice Detection and Monitoring Service in support to oceanographic missions
Drifting icebergs can pose a threat to research vessels and complicate the deployment of oceanographic equipment in the Austral seas. CLS has developed a reliable and accurate ice detection and forecasting service to help ensure the security of these missions and/or recommend best zones for deployment. Based on SAR imagery and using an ocean drift model that combines remote sensing, in-situ and EO data, CLS analysts provide daily bulletins with location of potentially dangerous icebergs (100 m and larger) and forecast their positions for the next three days.
How it works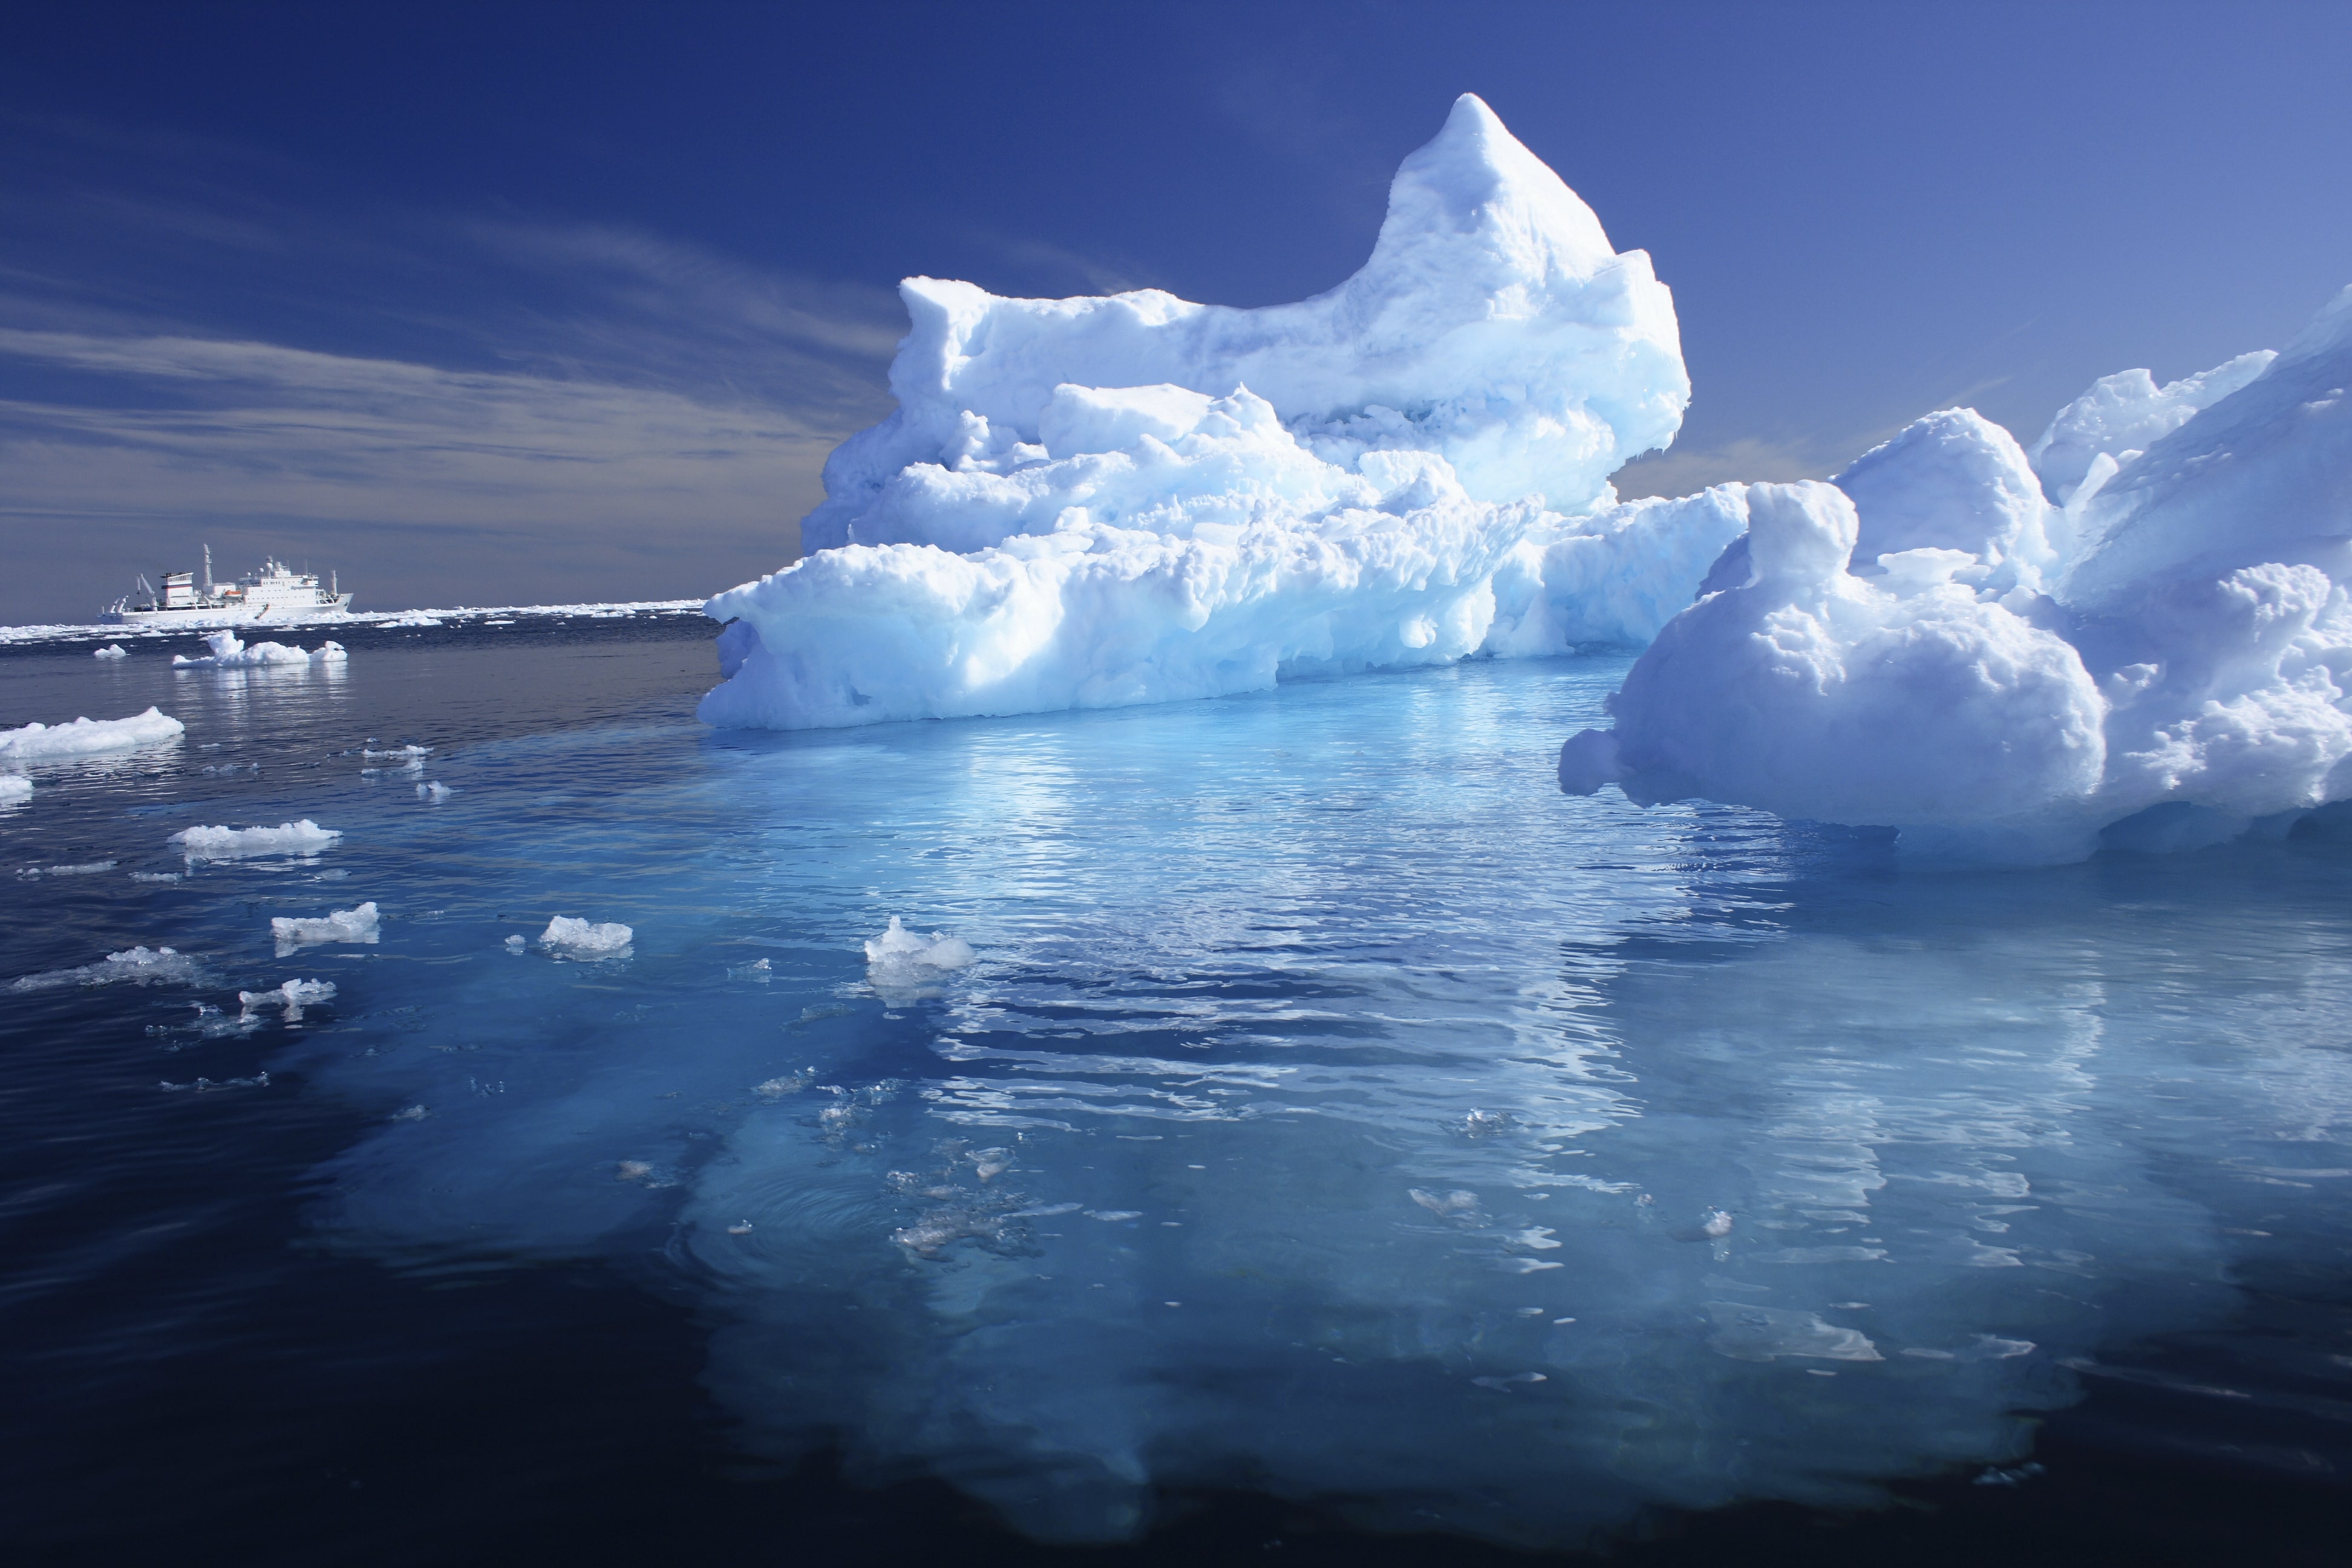
CLS oceanographers perform a preliminary study of the proposed research zone based on altimetry (qualification of ice conditions, detection of icebergs), sea surface temperature data and SAR imagery. This study identifies potentially hazardous areas before the start of the mission, and prepares for reactive SAR programming when your vessel approaches risk areas.
Once the mission begins, CLS acquires satellite radar imagery and runs an ocean drift model that combines remote sensing, in-situ and EO data. CLS analysts then provide daily bulletins with location of potentially dangerous icebergs (100 m and larger) and forecast their positions up to three days ahead during your entire mission.
A 5-step process:
- Preliminary phase: CLS experts analyze the destination zone based on altimetry, sea surface temperature (SST) data and also locally on the analysis of medium-resolution optical images as well as SAR (Synthetic Aperture Radar) images.
- Selection of the radar image to be processed: CLS experts will select the appropriate radar image to be processed covering the navigation area.
- Ice detection: Each image will be analyzed by one of our trained analysts, who will cross-check possible detected icebergs with AIS data, temperature and other data to ensure the detection is accurate.
- Drift modelling for each detected iceberg: The iceberg position data will be injected into the drift model, along with temperature, wind field, surface current, tidal current, bathymetry and in situ observations from drifting buoys in order to predict the position of the iceberg in the next 3-days.
- Daily bulletin: CLS generates a bulletin, including the processed image and additional images with all the ice detections and associated drift simulations. These data can also be correlated with the position of the vessel or fleet.


Main benefits:
The strength of our service is the combined use of metocean data and various space observation techniques (altimetry, optical and SAR imagery) to understand the ice situation before your mission begins and predict its evolution.
 Drawing on SAR expertise
CLS is recognized as a main provider of satellite radar scenes and services and operates the first SAR ground receiving station in France (for civilian missions), called VIGISAT.
SAR imagery observes the ocean surface regardless of day/night and clouds conditions and thus has a unique advantage for scrutinizing the path ahead of research vessels.
 Capitalizing on 25 years of expertise in satellite altimetry
CLS has 90 in-house oceanographers and is an expert in satellite oceanography. We have contributed to the major international altimetry missions for over 25 years, developing high resolution oceanography products (currents, sea level anomalies, sea surface temperature) for a community of scientific users. Since 2012, we apply our understanding of sea state, sea ice and icebergs for navigational safety in the southern oceans.


